Are you looking for meaningful Climate Change Statistics, facts and figures? Then you've come to the right place! Our planet is warming at an unnaturally rapid pace - there is no longer any doubt about that. However, the greatest Environmental problem of our time not for most of us.
In this article, I'm going to give you the most important facts, statistics and figures about global warming. From scientific opinions about temperature values and CO₂ emissions to the effect of possible behavioral changes in our everyday lives.
Here is another short Table of contents about the contribution:
Note: If you use climate change statistics from this post, please credit the address of this page or the following source. Thanks for your support!
Schulz, C.; CareElite.de (2019): Climate change statistics, facts, figures, data & studies 2018/2019. https://www.careelite.de/klimawandel-statistiken-fakten/
Scientific statistics and figures on climate change and its consequences

Politicians also like to demand that experts make the important decisions. First of all, I would like to give you the opinions, evaluations and statistics of leading climate scientists.
Climate change facts from science
- Expert Opinion: More than 97% of all climate experts (more than 23,000 scientists) agree that climate change is man-made. Almost 12,000 studies were evaluated for this statistic.₁
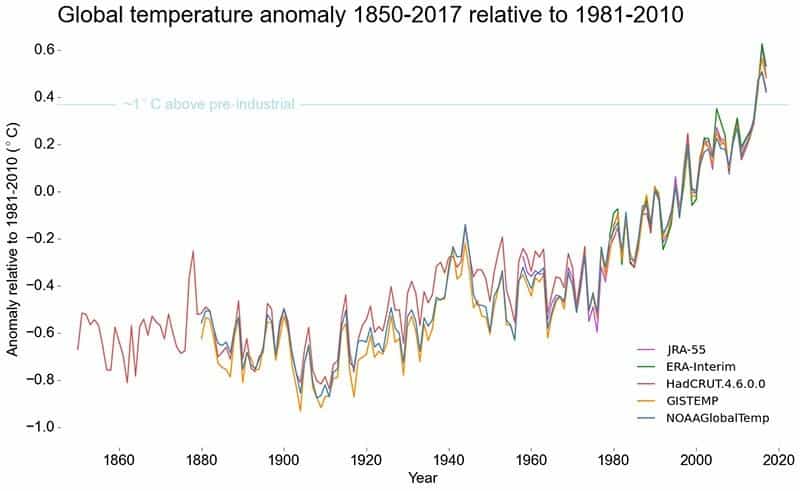
- Temperature comparison: According to NASA, 2017 was about 0.90 °C warmer than the average over the period 1951 to 1980.₂
- Temperature rise: The rate of increase calculated over 1956 to 2005 is (0.13 ± 0.03) °C per decade, almost twice that calculated over 1906 to 2005.₃
- CO₂ pricing: Scientists from the Mercator Research Institute on Global Commons and Climate Change (MCC) and the Potsdam Institute for Climate Impact Research (PIK) recommend a statutory CO₂ price with a steering effect. This should start at 50 euros for one ton of CO₂ in 2020 and rise to 130 euros by 2030.₄
Statistics and figures on the consequences of global warming
- Outdoor temperature: 16 of the 17 warmest years since temperature records began in 1880 occurred after 2000.₅
- Water temperature: The temperature of the upper water layers of the world's oceans rose by about 0.5 °C from 1980 to 2015.₆
- Ice Melt: Arctic sea ice is shrinking in its average annual extent by 2.7 percent per decade.₇ Greenland is losing 250 to 300 billion tons of ice per year.₈
- Sea level: Since 1990, sea levels have risen by a global average of about 20 centimeters.₉
- Germany: In the North Sea and Baltic Sea, an increase of 10 to 20 centimeters has been measured over the past hundred years - one consequence is that storm surges are higher. Per year, the sea level on the German North Sea coast rises by 1.6 to 1.8 millimeters.₁₀
- Environmental disasters: Globally, the number of climate-related disasters has tripled since 1980.₁₁
Tip: At Climate tilt elements you will find some more facts about possible chain reactions that could accelerate climate change.
Statistics on CO2-emissions by country

In 2017, the annual global CO₂ emissions 36,153 MtCO₂. In 2000, the figure was 24,559 MtCO₂.₁₂ Here you can find important, more detailed statistics on the CO₂ emissions of the individual countries and societies on our planet.
Total CO₂ emissions of the countries
First, we look at the total value of the countries' emissions. In this way, we get a picture of which country has particularly high CO₂ emissions. The values refer to the year 2017₁₃:
- China: In 2017, China emitted 9,839 MtCO₂. China is thus the global leader. In 2000, the figure was 6,001 MtCO₂.
- USA: In 2017, U.S. CO₂ emissions were 5,270 MtCO₂. In 2000, the figure was 6,001 MtCO₂.
- India: In 2017, India emitted 2,467 MtCO₂. In 2000, the figure was 1,030 MtCO₂.
- Russia: In 2017, Russia emitted 1,693 MtCO₂. In 2000, the figure was 1,500 MtCO₂.
- Japan: In 2017, Japan produced 1,205 MtCO₂. In 2000, the figure was 1,263 MtCO₂.
- Germany: Germany emitted 799 MtCO₂ in 2017. In 2000, the figure was 901 MtCO₂.
- It follows the Iran (672 MtCO₂ in 2017), Saudi Arabia (635 MtCO₂) and South Korea (616 MtCO₂).
Notice: MtCO₂ means megatons of CO₂. One megaton is one million tons.
Example: 9,839 MtCO₂ = 9,839,000,000 tons CO₂
Average CO₂ emissions per capita
In relation to the number of inhabitants in the country, a different order emerges. These statistics on climate change say much more about the respective society. These facts are based on values from 2016₁₄:
- Qatar: 30.77 tons CO₂/inhabitant
- United Arab Emirates: 20.69 tons CO₂/inhabitant
- Saudi Arabia: 16.34 tons CO₂/inhabitant
- Australia: 16 tons CO₂/inhabitant
- USA: Tons 14.95 tons CO₂/inhabitant
- Canada: 14.91 tons CO₂/inhabitant
- South Korea: 11.5 tons CO₂/inhabitant
- Russia: 9.97 tons CO₂/inhabitant
- Netherlands: 9.23 tons CO₂/inhabitant
- Japan: 9.04 tons CO₂/inhabitant
- Germany: 8.88 tons CO₂/inhabitant
In India for example, only 1.57 metric tons of CO₂ are emitted per capita. However, the country is in third place in terms of total emissions.
Important studies on climate change

Most of the facts and figures from this article are Scientific studies on global warming on the basis of. Here you can find some of the most important studies:
- The Third Degree - Evidence and implications for Australia of existential climate-related security risk, Breakthrough - National Centre for Climate Restoration, July 2019.
- Global Warming of 1.5 ºC, The Intergovernmental Panel on Climate Change, IPCC.
- Climate Change and Land, IPCC.
- Global Climate Report - May 2017, NOAA.
- And it's warming after all - "What's behind the climate change debate?", Federal Environment Agency, 2013.
- Global Climate Change - Causes, Consequences, Options for Action, Germanwatch.
- Global Climate Change, NASA.
- BROWN TO GREEN - THE G20 TRANSITION TOWARDS A NET-ZERO EMISSIONS ECONOMY, Climate Transparency, Berlin, 2019.
Question: Do you have other meaningful climate change studies that I should include here? Then feel free to write a comment below this post.
Climate change projections
Of course, forecasts should always be taken with a grain of salt. Here are some assessments by scientists for the future associated with climate change:
- Sea level: Sea levels will already have risen by half a meter by 2050.₁₅
- Adjustment costs: The OECD estimates that the member states will have to budget 95 billion euros per year in future just for adapting to the changed environmental conditions.₁₆
- Drinking water: For 2050, additional costs for drinking water supply worldwide (see Water Shortage) of around $12 billion per year is expected.₁₇
Statistics on behavioral changes against climate change

I have now given you many figures and statistics on climate change. We as a global population can of course stop this environmental problem if we manage to adapt our lifestyles. Here are some statistics on sensible behavioral changes in your own everyday life:
- Vegan diet: 49 percent of global CO₂ emissions caused by our food could be saved if all the people on the planet vegan diet would.₁₈
- Meat abstinence: If all citizens of Germany were to become Become vegetarianan approximate CO₂ emission of 37 million tons could be saved.₁₉
- Demonstrations: In Germany on Sept. 20, 2019, about 1.4 million people responded to the call of the Climate Protection Movement #FridaysForFuturein order to get politicians to work together for effective climate protection.₂₀
Notice: In a separate post I will give you again in detail Tips you can use in everyday life against climate change can implement. Here, however, we will now deal with figures and statistics on climate change.
Use climate change statistics and create awareness
The facts and figures surrounding climate change are scary, aren't they? And that's a good thing! After all, this accelerates the Change processthat each of us has to go through. And it's not that complicated. Just look in the article about the sustainable life to learn how you can easily start living a greener lifestyle.
Use the facts, figures, statistics, data and studies in this article to make the environmental problem of global warming more tangible for you and others. If you have any questions, tips or suggestions, please write a comment below this article.
Stay sustainable,

PS.: Do you know the problem with the Plastic waste in the environment? Also for this I have given you under Plastic waste statistics, facts and figures valuable information provided.
If you use climate change statistics from this post, please cite the following source. Thanks for your support!
https://www.careelite.de/klimawandel-statistiken-fakten/References:
₁ Cook, J.; Nuccitelli, D.;Green, S.; et al: Quantifying the consensus on anthropogenic global warming in the scientific literature. (Accessed May 15, 2013). https://iopscience.iop.org/article/10.1088/1748-9326/8/2/024024. [23.12.2019].
₂ Cole, Steve; McCarthy, Leslie (2018): Long-Term Warming Trend Continued in 2017: NASA NOAA (as of 01/18/2018). https://www.nasa.gov/press-release/long-term-warming-trend-continued-in-2017-nasa-noaa. [09.08.2019].
₃ IPCC (2007): Climate Change 2007 - Working Group I: The Physical Science Basis, https://www.ipcc.ch/site/assets/uploads/2018/02/ar4-wg1-spm-1.pdf, Executive Summary. IPCC, 2007, P.5.
₄ Edenhofer, O., Flachsland, C., Kalkuhl, M., et al; MCC, PIK (2019): Options for a CO2 Price Reform - MCC-PIK Expert Report for the German Council of Economic Experts, Berlin, July 2019, p.74.
₅ Smart Energy for Europe Platform (SEFEP) gGmbH: Climate change - a fact sheet. https://www.klimafakten.de/meldung/klimawandel-eine-faktenliste. [24.10.2019].
₆ CNOAA National Centers for Environmental information, Climate at a Glance: Global Time Series (as of October 2019) from https://www.ncdc.noaa.gov/cag/global/time-series/globe/ocean/ytd/12/1880-2017 [24 Oct. 2019].
₇ Federal Environment Agency: Observed Climate Change (as of: 25.07.2013). https://www.umweltbundesamt.de/themen/klima-energie/klimawandel/beobachteter-klimawandel. [09.08.2019].
₈ German Federal Ministry for the Environment, Nature Conservation and Nuclear Safety (2018): Klimaschutz in Zahlen - Fakten, Trends und Impulse deutscher Klimapolitik. Edition 2018. p. 15.
₉ Prof. Dr. Karen Helen Wiltshire (2019): Federal Press Conference #Scientists4Future, March 12, 2019.
₁₀ Brasseur, G., Jacob, D., Schuck-Zöller, S.: Klimawandel in Deutschland - Entwicklung, Folgen, Risiken und Perspektiven, 2017, pp. 78 - 83.
₁₁ National Geographic: 7 Facts About Climate Change. https://www.nationalgeographic.de/7-fakten-zum-klimawandel. [09.08.2019].
₁₂ Statista GmbH: Development of global CO₂ emissions from 1995 to 2017. (As at: August 12, 2019). , https://de.statista.com/statistik/daten/studie/208750/umfrage/weltweiter-co2-ausstoss. [23.10.2019].
₁₃ Global Carbon Project (GCP): GLOBAL CARBON ATLAS. http://www.globalcarbonatlas.org/en/CO2-emissions. [23.10.2019].
₁₄ Statista GmbH: Per capita CO2 emissions by selected countries worldwide in 2016 (as of October 15, 2019). https://de.statista.com/statistik/daten/studie/167877/umfrage/co-emissionen-nach-laendern-je-einwohner. [24.10.2019].
₁₅ Utopia GmbH: Climate Forecast 2050: "High probability that human civilization will end" (as of 07.06.2019). https://utopia.de/klimawandel-prognose-2050-142678. [23.10.2019].
₁₆ Norddeutscher Rundfunk: How much does the world cost? - The economic consequences of climate change (as of July 17, 2008). https://www.tagesschau.de/wirtschaft/klimawandel116.html.[24 OCT. 2019].
₁₇ Ward, P., Strzepek, K., Paul, W.: Partial costs of global climate change adaptation for the supply of raw industrial and municipal water: a methodology and application (as of 07.12.2010). https://iopscience.iop.org/article/10.1088/1748-9326/5/4/044011. [24.10.2019].
₁₈ Poore, J., Nemecek, T.: Reducing food's environmental impacts through producers and consumers (as of 01 June 2018). https://science.sciencemag.org/content/360/6392/987. [23.10.2019].
₁₉ Merlot, J.; DER SPIEGEL GmbH & Co. KG: What giving up meat can do for climate protection (as of 08.08.2019). https://www.spiegel.de/wissenschaft/mensch/berechnung-zum-klimaeffekt-was-fleischverzicht-fuer-den-klimaschutz-bringt-a-1280923.html. [24.10.2019].
₂₀ n-tv Nachrichtenfernsehen GmbH: Global climate strike - 1.4 million demonstrate in Germany1.4 million demonstrate in Germany (as of September 20, 2019). https://www.n-tv.de/politik/1-4-Millionen-demonstrieren-in-Deutschland-article21285481.html.


